An HPLC chromatogram is a graph of detector signal against time: each peak is a substance leaving the column, its position on the time axis helps identify it, and its area measures how much signal it produced. On a peptide COA, the purity figure is usually the main peak's area as a percentage of the total area of all integrated peaks, so the chromatogram and its peak table are the evidence behind that number.
This note explains how to read the trace on a certificate of analysis, what the peak table should contain, why area percent is useful but incomplete, and the signs that a chromatogram was borrowed from another report.
What the two axes mean
The horizontal axis is retention time, normally in minutes from the moment the sample was injected. The vertical axis is the detector response. For peptides this is usually UV absorbance, reported in milli-absorbance units (mAU), at a wavelength near 214 nm. That wavelength is used because the peptide bond itself absorbs there: a study in the Journal of Agricultural and Food Chemistry measured the peptide bond's molar extinction coefficient at 214 nm so that peptides separated by reversed-phase HPLC could be compared quantitatively.
Most peptide purity methods are reversed-phase separations. The column is packed with a non-polar stationary phase, commonly C18 chains bonded to silica, and the mobile phase is water mixed with a polar organic solvent such as acetonitrile, as described in Harvey's analytical chemistry text. Compounds that interact more strongly with the column come off later. A gradient that increases the organic solvent over time pushes the more strongly held compounds off in turn.
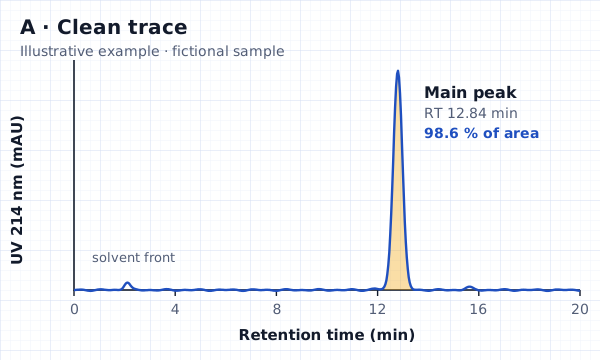
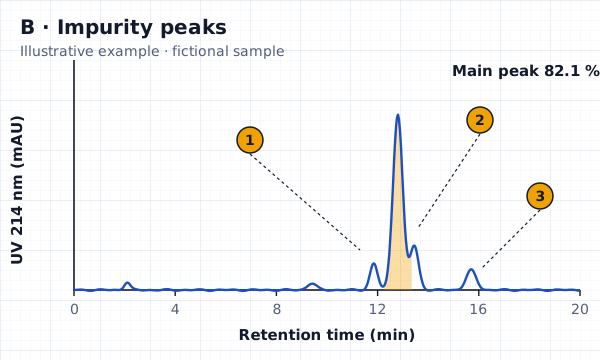
Reading the main peak
A well-behaved main peak is tall, narrow and close to symmetrical, and it sits well clear of its neighbours. The retention time printed against it should be consistent with the method on the report: the same peptide run on the same method should come off at about the same time, which is why labs compare it against a reference standard when they have one.
Three shapes deserve a closer look. A shoulder, like peak 2 in Fig. 2, is a second compound only partly separated from the main one. Tailing, a long slope on the right side, can come from the column or the method rather than an impurity, but it makes small impurities harder to see. A split or doubled main peak can mean two closely related compounds, or a problem with the run. None of these is proof of a bad product. Each is a reason to ask the lab how the peaks were integrated.
The peak table: where the purity number comes from
The peak table lists every integrated peak with its retention time and area, and the area percent column should add up to about 100. Using the fictional trace in Fig. 1, the table would read:
| Peak | Retention time (min) | Area % | Note |
|---|---|---|---|
| 1 | 2.10 | 0.4 | Solvent front, often excluded by the method |
| 2 | 11.90 | 0.6 | Minor related peak |
| 3 | 12.84 | 98.6 | Main peak: the reported purity |
| 4 | 15.60 | 0.4 | Minor late peak |
Two details matter. First, the method decides which peaks count: some methods exclude the solvent front or blank peaks, and the report should say so. Second, the purity on the front page should match the main peak's area percent in the table. If the front page says 99.2% and the table says 98.6%, ask why. A worked example of reading a peptide test result from start to finish is published by Peptide Testing Australia and follows the same logic.
What impurity peaks can be
A UV detector shows that something is there, not what it is. In synthetic peptides, the European Medicines Agency's guideline on synthetic peptides lists the kinds of peptide-related impurities manufacturers must consider, including deletion sequences (one or more amino acids missing), truncated sequences, insertion sequences (an amino acid coupled twice), the wrong enantiomers or diastereomers, and degradation products from oxidation or deamidation. Many of these sit close to the main peak because they are nearly the same molecule.
Putting a name to an impurity peak needs a second technique, usually mass spectrometry. Our note on HPLC-MS and mass spectrometry covers how that works.
Why area percent isn't the whole story
Area percent assumes every compound produces the same signal for the same amount, and that assumption is only roughly true. The same 214 nm study found that tryptophan absorbs about 30 times more strongly than a peptide bond, and phenylalanine, tyrosine and histidine about six times more. An impurity with an extra or missing aromatic residue can therefore be over- or under-counted.
Other limits are structural:
- Co-elution. Two compounds leaving the column together appear as one peak. The EMA guideline warns about co-eluting impurities and expects additional methods where one method can't separate them.
- Invisible material. Water, salts and counter-ions such as acetate or trifluoroacetate don't appear as peptide peaks at 214 nm, so a high HPLC purity says nothing about how much of the powder is peptide.
- Integration choices. Where the software draws the baseline and splits overlapping peaks changes the numbers. A good report states the integration approach or at least shows the integrated peaks.
Signs a chromatogram was copied or edited
Real chromatograms are messy in small, specific ways. Every run has its own baseline noise, small bumps and exact retention times. That makes copies easier to spot than you might expect:
- The trace has no axes, no units or no time scale.
- The same trace, down to the small bumps, appears on reports for different batches or different peptides.
- The peak table doesn't match the picture: a peak in the table has no peak in the trace, or the other way round.
- The image is a low-resolution screenshot pasted onto a crisp document, or text around the trace has been retyped in a different font.
- The retention time is implausible for the gradient and column described, or no method details are given at all.
The wider set of document checks is in fake COA red flags.
Questions to ask the laboratory about a chromatogram
- Which column, mobile phases, gradient and detection wavelength were used?
- Which peaks were excluded from the purity calculation, and why?
- Was the main peak compared against a reference standard?
- Does the identity result come from the same sample and run?
A laboratory that ran the test can answer these from its records. A document that can't support those answers is a picture of a chromatogram, not evidence.
Questions
What does a chromatogram in HPLC show?
It shows detector signal against time as the sample's components leave the column. Each peak is a separated substance; its retention time helps identify it and its area indicates how much signal it gave.
What is retention time on a COA?
Retention time is how long after injection a compound reaches the detector, usually in minutes. On the same method, the same peptide should come off at about the same time, which is why labs compare it with a reference standard.
Why are there several peaks on my COA chromatogram?
Small peaks can be peptide-related impurities, the solvent front or blank peaks. The peak table and method should say which peaks were counted. Only a second technique such as mass spectrometry can say what an impurity peak is.
Can two different peptides have the same retention time?
Yes. Retention time on one method is supporting evidence, not proof of identity. That is why identity is confirmed with mass spectrometry and, in medicine regulation, with at least two orthogonal methods.